Problem
How a filter in Power BI can be dynamic and reflect other slicers and interaction in the dashboard?
Solution
If you need a filter set on a chart or table be dynamic, the value needs to be determined by a measure and not a column. Columns are static calculations only udpated during data processing. Below is a example how to use measures to this end.
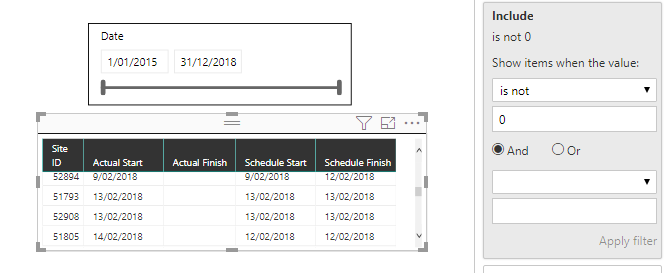
Suppose you have Date slicer and your main table includes data related to Schedule Start/Schedule Finish/Actual Start/Actual Finish. You need to show the table of data but only include scheduled/actual dates that fall inside main “Date” slicer.
Include =
IF(MAX(Events[Schedule Start])>=MIN(Dates[Date]) && MAX(Events[Schedule Start])<=MAX(Dates[Date]),1,0) +
IF(MAX(Events[Schedule Finish])>=MIN(Dates[Date]) && MAX(Events[Schedule Finish])<=MAX(Dates[Date]),1,0) +
IF(MAX(Events[Actual Start])>=MIN(Dates[Date]) && MAX(Events[Actual Start])<=MAX(Dates[Date]),1,0) +
IF(MAX(Events[Actual Finish])>=MIN(Dates[Date]) && MAX(Events[Actual Finish])<=MAX(Dates[Date]),1,0)
Now visualise the table Events and put this measure in the filter and set it to “is not 0″3
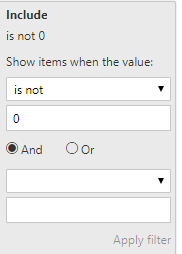
Now the “Include” filter is dynamically calculated based on “Date” slicer. Be aware in case the data size is high this could be a slow dashboard to dynamically refresh.